Icons have long been a cornerstone of GUI design, ever since the emergence of WIMP (Windows, Icons, Menus, Pointers) by Xerox. Given the “Mobile App Boom” there’s even more functionality being expressed via icons than ever before. Figuring out which icons work best is no easy task, and to compound matters even further, what makes a good icon often depends on the beholder of the icon in question.
Most important is whether users have an easy time understanding and finding the icons in a given graphical user interface (GUI). In some cases it is possible to rely on a well established iconography and leverage well known symbols.
But what if there is no established iconography, or what if the established symbol is losing it’s relevance, like the floppy disk?
Traditionally you’d rely on an icon designer coupled with user testing if your budget allows for it. But user testing is both time consuming and expensive. This is where our method helps with the heavy lifting and provides a objective evaluation of the available icon candidates.
Publication and resources
- Icon Set Selection via Human Computation
Lasse Farnung Laursen, Yuki Koyama, Hsiang-Ting Chen, Elena Garces, Diego Gutierrez, Richard Harper, Takeo Igarashi, in Pacific Graphics ’16: The 24th Pacific Conference on Computer Graphics and Applications,
Local PDF | Published PDF - Supplemental material – Icons, Filters, and Crowdworker tutorials
Quick Facts
- Conceived and implemented over the course of six months.
- Produces icon-sets optimized for comprehensibility and identifiability.
- Method applied with approximately 2500 human computation worker costing approximately 500 USD.
- User tested 4 icon-set selected via our method using the same pool of icons with over 50 participants per set.
- Surveyed popular VJ software and surveyed artists to determine top 9 filters and create an optimized icon set for visual filters.
- The most comprehensible method selected icon-set surpasses the hand-picked designer icon-set in terms of comprehensibility.
- Created in collaboration with Microsoft Research Cambridge.
Important icon properties
Our goal is to select a set of icons that optimized for important icon properties, but before we get to these important properties, we briefly need to clarify what an icon is. An icon consists of a signifier, the shape which the icon takes, and the signified, the concept the shape/icon represents. For example, a traffic sign with a train on it (signifier) can represent a railroad crossing (signified). When designing a new icon, one of the most important tasks is to choose the right signifier. The signifier determines an icon’s comprehensibility and identifiability.
Comprehensibility describes how well an icon communicates what it is intended to represent to the user. Identifiability refers to how visually distinguishable an icon is, i.e. how easily it is found among other icons. Both these properties are of high importance when determining if an icon works well as part of a graphical user interface. These are the properties we wish to optimize.
Comprehensibility and identifiability are dependent on the end user. Crudely speaking, how identifiable and comprehensible an icon is, will vary from person to person depending on their experience, culture, preferences, etc. None of these concepts are absolute or universal; they are, at best, conventions. It is no surprise then, that effective signifiers are often re-used, such as a trash-can signifying deletion, or a floppy disk signifying saving data. However, in some cases there are no widely established signifiers to rely on. Additionally, even well-established signifiers – such as the floppy disk – may find their usefulness diminish as the referenced object disappears from popular culture.
Method overview
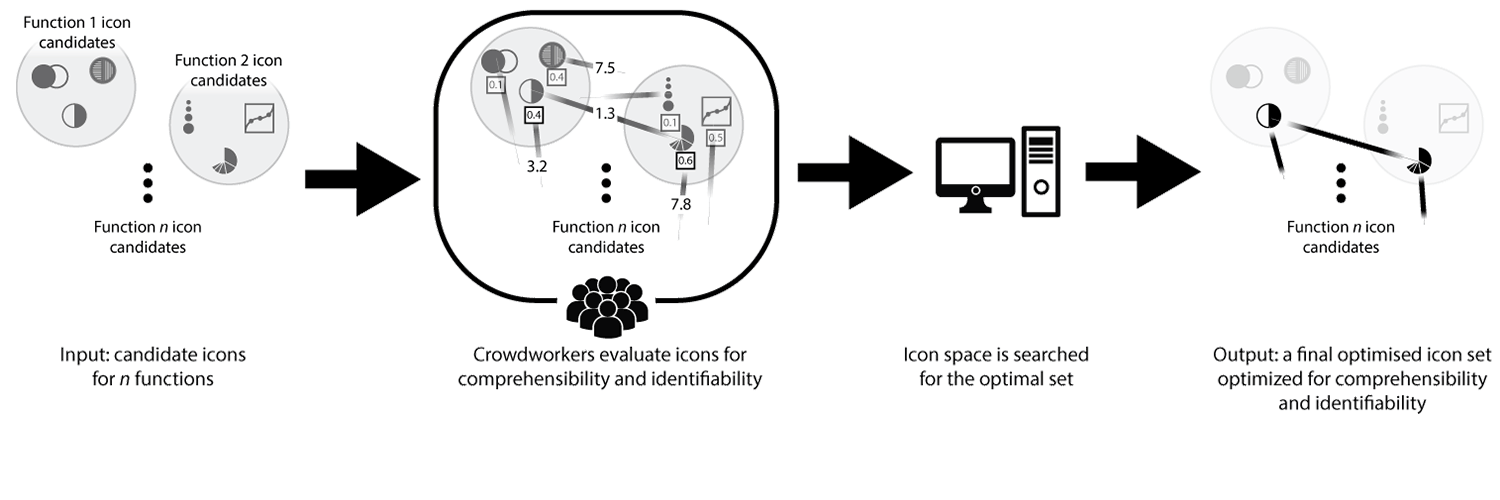
Having determined which icon properties we’re trying to optimize, let’s look at a general overview of our method:
- Our method accepts n icon candidate groups as input. Each group represents one function/concept and may contain an arbitrary number of icons. For the sake of simplicity we pretend that each group contains the same number of candidates throughout the description of our method.
- All icons within these groups are measured for comprehensibility and identifiability, using human computation. We compare the various icons in-between eachother and determine both comprehensibility and identifiability using human computation.
- Having estimated each icons comprehensibility and identifiability score, an exhaustive search is performed to find a complete icon set optimized for both these properties.
- A complete optimized icon set is found!
Icon set optimization
In order to measure both comprehensibility and identifiability we need to compare all of our icons to one another. Comprehensibility and identifiability each require a unique approach to estimate. Which icon best communicates a given function (comprehensibility) depends on the other candidates representing the same function in question. Thus, we need to perform a comparison between every icon intended to represent the same function. Which icon is most visually distinguishable is a more complex problem, as it depends on the other icons it is to be presented among. Therefore, we must compare every icon intended to represent a given function with all icons representing other functionality. Although this can result in a significant number of comparisons, it generalizes our approach to support any type and amount of functionality.
Comprehensibility, i.e. which icon best communicates a given function, depends on the other candidates representing the same function in question. Therefore we need to perform a comparison between every icon intended to represent the same function. We show workers participating in our human-computation tasks to pick between two candidate icons, to describe a function/concept. With sufficient data we apply the Bradley-Terry model as described by Caron and Doucet to determine a ranking in-between all of the icons according to comprehensibility.
Identifiability, i.e. how easily an icon is found among other icons, relies on inter-icon-candidate group comparisons. Meaning a single icon from a given icon candidate group has to be compared to all icons from all other icon candidate groups. Workers participating in our human-computation task are asked to pick which of two icons from one candidate group is most similar to an icon from a different candidate group. Once we’ve collected enough comparison data via human computation we use stochastic triplet embedding as described by Maaten and Weinberg to determine how these icons might lie in a euclidean space.
The exact formula, which is further detailed in our paper, is as follows:
(1) 
The parameter Φ allows the user to preference either comprehensibility or identifiability. The function comp() returns a ranking score determined by the Bradley-Terry model, as described by Caron and Doucet . The function dist() returns the euclidean distance between two icons calculated using stochastic triplet embedding as described by Maaten and Weinberger. Since we are interested in maximizing the perceived visual difference between all icons in our complete set, we use the smallest distance (within a set of distances) as an indicator for how visually distinct the complete icon set is.
User study
We conducted a user study that compared the comprehensibility and identifiability between four complete icon sets produced by our method (highlighted with a shaded background) and one complete icon set chosen by the original icon designer. Among the four generated sets, two sets were optimized for only identifiability/comprehensibility and two sets covers the Φ spread of 0.2-0.5 and 0.7-1.0 to maximize variety.
To test comprehensibility, we present each participant with a representation of one of our nine visual filters and a complete icon set below. The participants are then asked to pick the icon they feel best represents the filter. They are explicitly informed that they can pick the same icon multiple times, for different filters. This task is repeated once for every filter. The icon set order is randomized for every user, but kept in that same order for the duration of the nine tasks, so the user can rely on spatial awareness to avoid unintentionally selecting the same icon multiple times.
To test identifiability, we show each participant one of the nine icons on screen and ask them to memorize it. On the following screen the users are asked to pick the icon they just memorized as quickly as possible, among the complete icon set. This task is repeated once for each of the nine icons, and the complete set is always shown in a randomized order.
We compare our estimated comprehensibility and identifiability scores with the results from our user study. There is a correlation between the comprehensibility score as determined by our method and the percentage of correctly picked icons (during comprehensibility tasks) from a given set. The results pertaining to identifiability did not yield significant results. Furthermore our results indicate that icon sets picked using our method can have a similar or higher comprehensibility score as one picked by a designer. For functionality without a well established iconography, or GUI’s with a high amount of functionality to represent, our method becomes particularly helpful. Without past signs or symbols to rely on, or with an increasing number of hard-to-quantify user preferences, manually picking the best icons becomes very difficult. Using our method, the icon designer can be left to focus on simply coming up with as many representative icons as possible.
Acknowledgements
Thank you to Yuki Koyama, Hsiang-Ting Chen, Elena Garces, Diego Gutierrez, Richard Harper, and last but certainly not least Takeo Igarashi for their help in creating this work.
I’d also like to thank participating artists, Adam Kendall, Ana Carvalho, Benton C Bainbridge, and Oli Sorenson, the helpful individuals at Microsoft Cambridge Research, the participating crowd-workers, and Iliyan Nachev who designed all the icon candidates.